Internet Provider Guides by State
Analyze which provider labels recur across state top-four footprints, then open FCC-based snapshots showing common technologies and what to verify before switching. Source data reflects the FCC fixed broadband snapshot as of December 31, 2025.
Official source and methodology
How to read the coverage snapshots
FCC fixed broadband availability data as of December 31, 2025; source files last updated July 21, 2026. Review the exact FCC National Broadband Map downloads and the official FCC Broadband Data Collection source and methodology. Availability is provider-reported, and provider footprints can overlap. The percentages are not market share, measured speed, or a guarantee that a provider serves a particular address. Confirm the exact technology, tier, terms, and address eligibility before switching service.
The machine-readable release contains 349 provider-state entries. Ranked non-satellite footprints and separately listed satellite options use distinct entry types.
Reproducible national analysis
Which provider brands recur in state top-four footprints?
This derived view counts how often each normalized provider label appears among the four broadest non-satellite footprints in each state profile. It also counts first-place appearances and calculates the median reported footprint only across the states where that provider is listed.
It is not a provider ranking, competition score, subscriber count, speed comparison, or address-level availability estimate. Provider footprints overlap, state populations differ, and the source rows are a curated top-four view rather than a complete provider inventory.
50
state profiles
All U.S. states are represented.
200
ranked footprint rows
Four non-satellite rows per state.
25
normalized provider labels
Labels can group source operating entities.
149
satellite-option rows
Kept outside the ranked comparison.
Most state top-four appearances
T-Mobile 5G Home: 49 of 50 states
Its median listed footprint is 67.0% across those appearances. This frequency does not mean the provider serves every address in those states.
Most first-place state footprints
T-Mobile 5G Home: 17 states
“First place” means the broadest normalized non-satellite footprint in that state's four-row profile. It does not compare speeds, prices, service quality, or subscriptions.
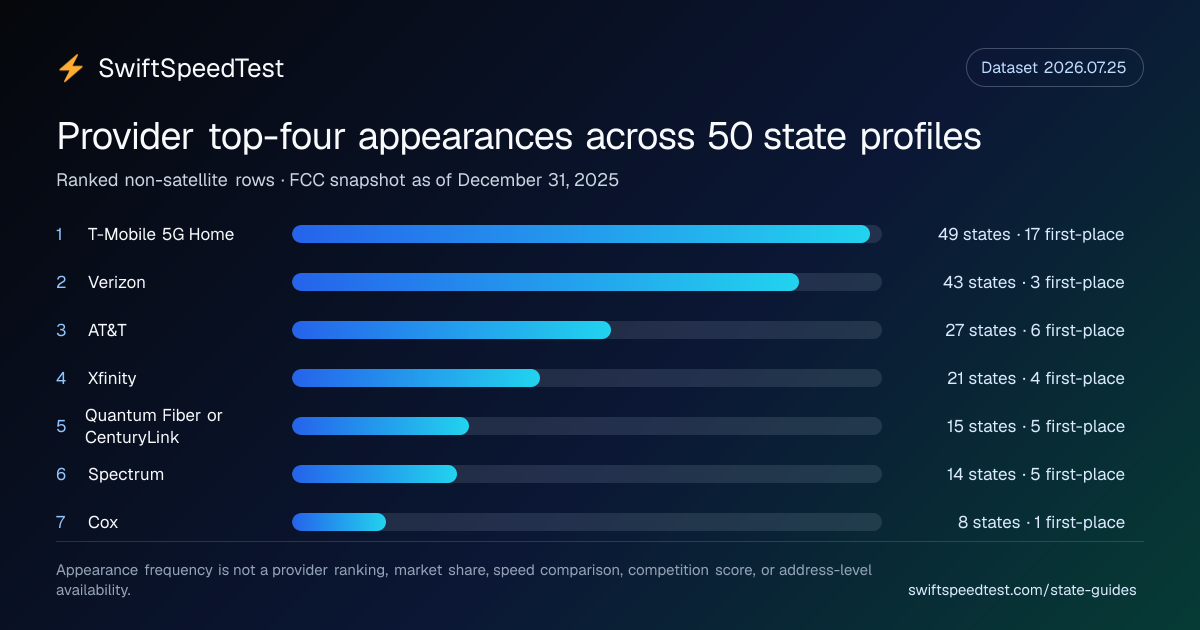
Top-four appearances by provider
Bar length is the share of 50 state profiles in which the provider appears.
Dataset version 2026.07.25
- T-Mobile 5G Home49 states · 17 first-place
- Verizon43 states · 3 first-place
- AT&T27 states · 6 first-place
- Xfinity21 states · 4 first-place
- Quantum Fiber or CenturyLink15 states · 5 first-place
- Spectrum14 states · 5 first-place
- Cox8 states · 1 first-place
Complete derived summary
Median and maximum percentages use only a provider's listed top-four state rows. The “largest listed states” links lead to the underlying state profiles.
| Provider label | State top-four appearances | First-place states | Median listed footprint | Maximum listed footprint | Largest listed states |
|---|---|---|---|---|---|
| T-Mobile 5G Home | 49 of 50 | 17 | 67.0% | 78.2% | |
| Verizon | 43 of 50 | 3 | 55.6% | 88.2% | |
| AT&T | 27 of 50 | 6 | 61.4% | 74.9% | |
| Xfinity | 21 of 50 | 4 | 63.5% | 89.4% | |
| Quantum Fiber or CenturyLink | 15 of 50 | 5 | 58.2% | 85.2% | |
| Spectrum | 14 of 50 | 5 | 59.9% | 92.3% | |
| Cox | 8 of 50 | 1 | 42.3% | 91.9% | |
| Fidium Fiber | 3 of 50 | 1 | 66.1% | 72.8% | |
| Midco | 2 of 50 | 2 | 65.6% | 70.2% | |
| Frontier | 2 of 50 | 0 | 56.1% | 69.0% | |
| Optimum | 2 of 50 | 0 | 30.7% | 32.2% | |
| VTel Wireless | 1 of 50 | 1 | 88.2% | 88.2% | |
| Telapex | 1 of 50 | 1 | 81.2% | 81.2% | |
| ISP Industries LLC | 1 of 50 | 1 | 71.0% | 71.0% | |
| GCI | 1 of 50 | 1 | 70.4% | 70.4% | |
| Visionary Communications | 1 of 50 | 1 | 65.9% | 65.9% | |
| Mediacom | 1 of 50 | 1 | 63.8% | 63.8% | |
| Hawaiian Telcom | 1 of 50 | 0 | 79.8% | 79.8% | |
| Sparklight | 1 of 50 | 0 | 57.6% | 57.6% | |
| ATN International | 1 of 50 | 0 | 49.7% | 49.7% | |
| JAB Wireless | 1 of 50 | 0 | 43.4% | 43.4% | |
| Redzone Wireless | 1 of 50 | 0 | 39.6% | 39.6% | |
| Borealis Broadband Inc. | 1 of 50 | 0 | 25.7% | 25.7% | |
| SPITwSPOTS Inc. | 1 of 50 | 0 | 21.2% | 21.2% | |
| Hawaii Dialogix Telecom | 1 of 50 | 0 | 0.5% | 0.5% |
Reproduce this view from the current CSV or pin the immutable JSON release. Group ranked rows by provider label, count rows and display rank 1, then calculate the median only from non-null reported footprint percentages. Review the full source and selection method in the methodology above.
All state guides
Compare the top reported provider footprints and technology mixes before you run or interpret a local speed test.